pywatershed notes
A hydrologic model in Python
by pywatershed development team
Version 1.0.0 Extended Release Notes
These are the extended release notes. The official release notes are found here.
Purpose and scope of pywatershed version 1.0.0
An initial purpose of pywatershed is to modernize the legacy of hydrologic modeling at the USGS as encoded in the PRMS model. It is our goal to have pywatershed match as closely as possible to the results of PRMS to continue its use and legacy as the software evolves.
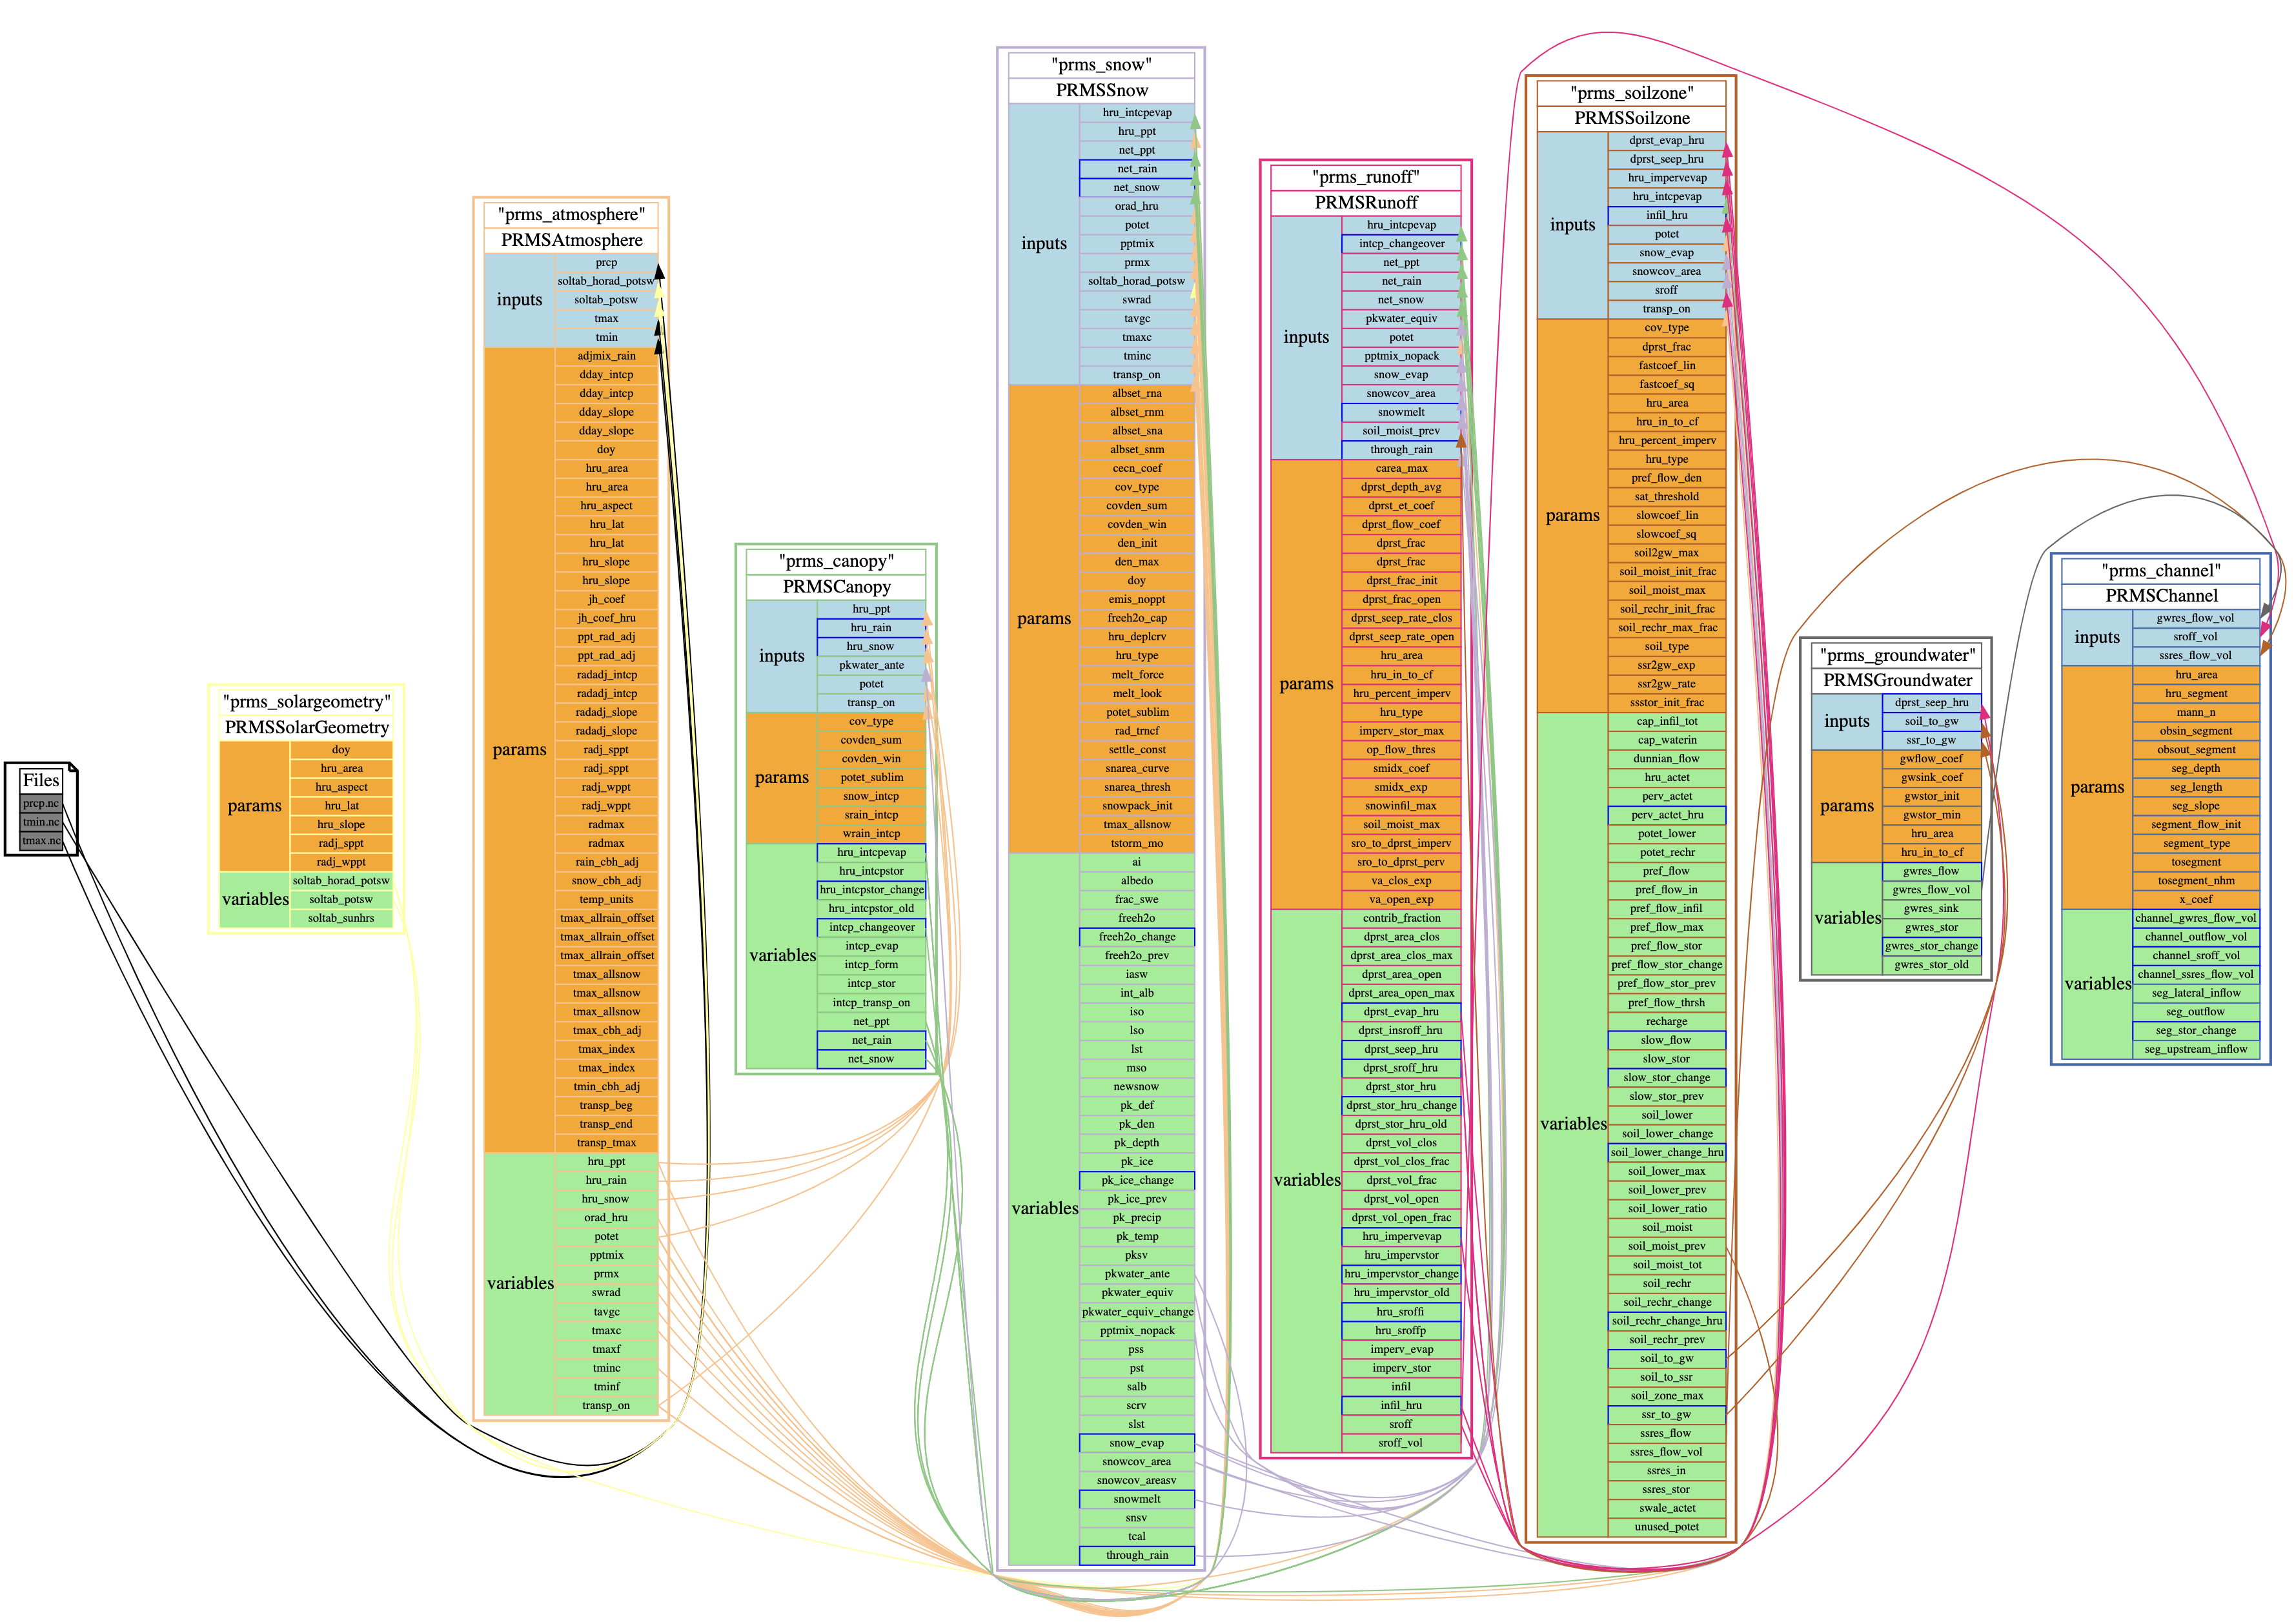
The scope of this release covers the NHM configuration of PRMS without the stream temperature model. PRMS options not included in the NHM are not supported in version 1.0.0. A schematic view of the NHM configuration within pywatershed is shown in Figure 1.
Future releases will cover additional features related to PRMS, GSFLOW, and other modeling capabilities.
Precision of variables and other PRMS changes
Pywatershed is written using double precision (64 bit) for all floating point variables. The PRMS v5.2.1 source code used as a reference for the pywatershed code contained mixed precision (32 and 64 bit) floating point variables. This numerical difference causes comparison issues and was eliminated by prompoting the PRMS v5.2.1 code (included in the pywatershed repository) to all double precision floating point variables.
Thus comparisons are not made against the mixed precision PRMS source code which is what nearly all PRMS users are using. Some differences were found between the mixed and double precision versions of PRMS, primarily in the snow variables. These differences are not addressed here. Comparisons of pywatershed are made against a double precision build of the PRMS 5.2.1 source contained within the pywatershed repository. This code contains a few other minor deviations from the released PRMS 5.2.1 as well.
Release results: Comparisons on CONUS
Comparisons can be made on any domain (space and time) running the NHM configuration. To help document how well pywatershed reproduces PRMS, we run a 2 year period using the NHM domain of the Continential United States (a.k.a CONUS). We have included statistics of the pywatershed and PRMS comparison as plots in these extended release notes. These can be navigated to by individual model processes at the bottom of the page. The plots show the distribution over all spatial units (HRUs or stream segments) of root mean squared error (RMSE) calcualted over time for selected variables. Similarly, the plots also show the distribution of relative RMSE (RRMSE) which is RMSE divided by the mean of the PRMS values at each location. The joint distribution of RMSE and RRMSE over locations is also plotted as the goal is to have at least one of these “very small”. Note that for variables with locations that have mean zero over time, the points can not be plotted in the joint density or in the distribution of RRMSE.
The results show that the vast majority of the ~115,000 hydrologic response units (HRUs)
have identical results over the comparison period. An arbitrary level of .001 is used for both
RMSE (units of variable) and RRMSE (unitless) to identify the percentage of locations with worse
(larger) scores for both statistics. This percentage is printed in the title of the joint
density plot for the statistics on each varible. Generally, these percentages are very low. Only
for PRMSSnow, PRMSSoilzone, and PRMSChannel does any variable have more than 1 percent of points
having worse RMSE and RRMSE than the .001 threshold. PRMSSnow has been the most dificult
PRMS process to reproduce and its pkwater_equiv, snowcov_area, and snowmelt variables have
about 1-1.2% of locations on this CONUS evaluation which have worse scores of RMSE and RRMSE than
.001. Similarly in PRMSSoilzone, the soil_moist and soil_moist_tot variables have about 1.6-1.7%
of both RMSE and RRMSE beyond the threshold. For PRMSChannel, the number of segments exceeding the
statistical thresholds was even higher at 3.325%. Most of these cases appear to be the errors from
snow and soilzone making their way to the streamflow simulation. Visual inspection shows generally
small errors. For several segments with larger flows it is unclear if the errors at these locations
are caused by accumulated errors upstream or not. For PRMSChannel, we found that many of the RMSE
and RRMSE scores were very close to the .001 threshold for at least one of the statistics. Increasing
the threshold significantly reduces the percentage of segments with scores over both threshods as
shown in the following table.
| Thresholds of both RMSE and RRMSE | % segments exceeding both |
|---|---|
| .001 | 3.325 |
| .005 | 0.660 |
| .01 | 0.277 |
Comparisons for your applications
We expect to improve the above differences over time and with more applications of pywatershed. To
give users confidence in using pywatershed for their applications we provide a notebook to easily
produce many of the above analyses and more for their own domains:
examples/03_compare_pws_prms.ipynb
And we want to hear from you if pywatershed is not matching PRMS in you domains so that
we can close the gaps.
Navigate release results
| Overview of Release v1.0.0 | |||||
|---|---|---|---|---|---|
| PRMSAtmosphere | PRMSCanopy | PRMSSnow | PRMSRunoff | PRMSSoilzone | PRMSChannel |